Cluster Monitoring
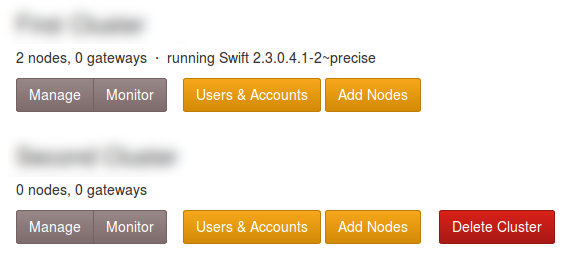
To view the Cluster Monitoring graphs, click on the Clusters link in the header, followed by Monitor for the desired cluster.
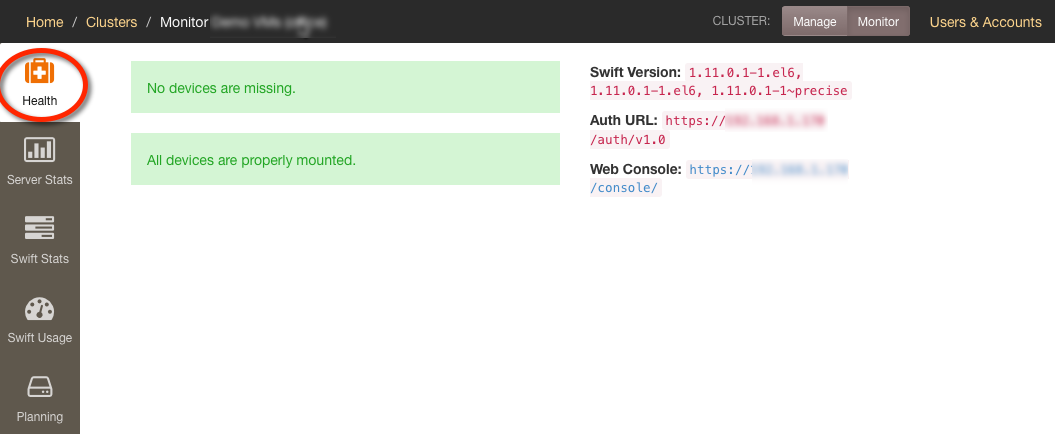
Cluster Health
The Cluster Health tab gives you a quick view of the state of the nodes and their drives, Swift version and Auth URL.
Server Stats
The Server Stats tab displays server activity not specific to Swift.
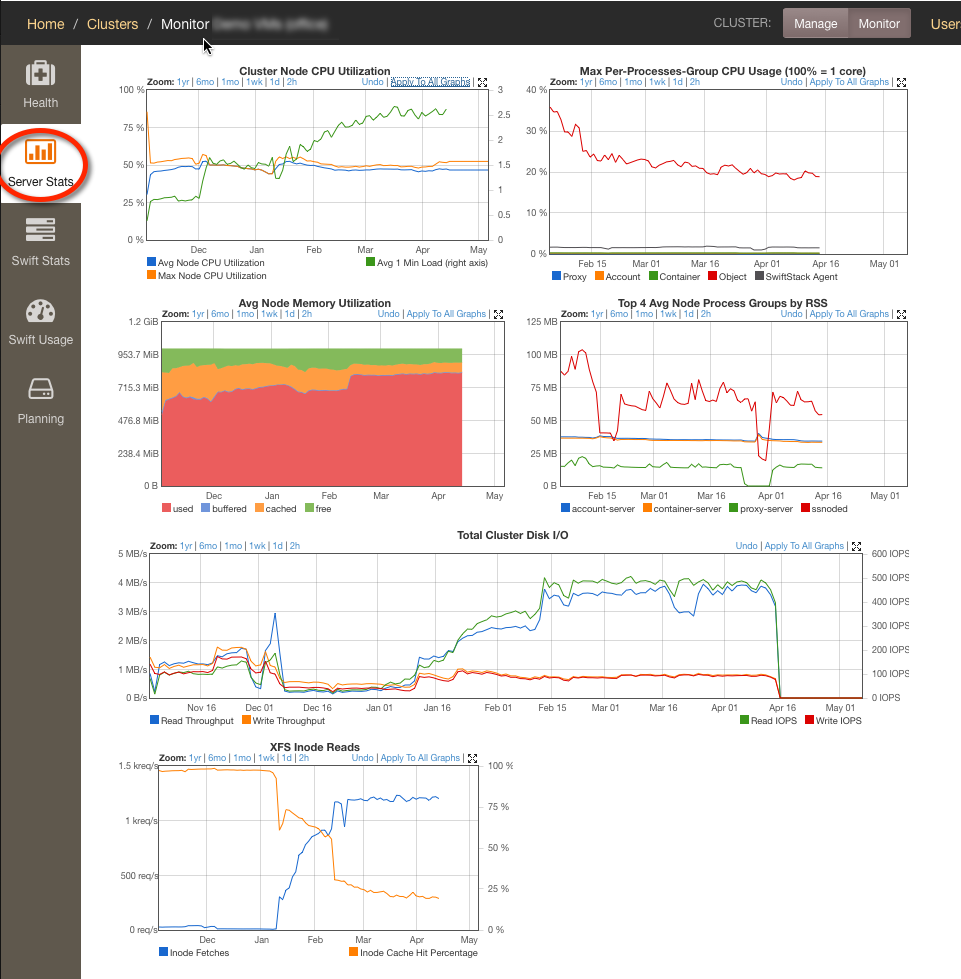
| Cluster CPU Utilization | Displays the average CPU utilization percentage across all nodes, the single highest node CPU utilization, and the average 1-minute load average across all nodes (right-hand Y-axis). High numbers are generally bad. If your CPU utilization is high, processes may have a harder time getting resources. This means that processes on this node will start to slow down and that it may be time to add additional nodes to the cluster. |
| Max Per-Processes-Group CPU Usage | Displays the maximum amount of CPU used by a process group on a single node. A spike in this graph indicates that at least one node is experiencing issues with that process type. |
| Average Node Memory Utilization | Average memory utilization of all nodes in the cluster. This graph will be less useful when cluster nodes' memory capacities differ. Memory usage is categorized into user-space (used), kernel buffers (buffered), kernel buffercache (cached), and free space. It is normal for Linux to utilize free physical RAM for buffercache. So a small amount of "free" RAM is probably okay. |
| Top 4 Avg Node Process Groups by RSS | Displays the four process groups using the most memory, and how much memory those processes are using, averaged across all cluster nodes. |
| Total Cluster Disk I/O | Measures the total number of Input/Output Operations Per Second (IOPS) on drives. Disk I/O is shown for both Read IOPS and Write IOPS. This graph also reports read/write throughput in addition to IOPS. Note that since Swift constantly guards against bitrot, the cluster will continuously read some amount of data. |
Swift Stats
The Swift Stats tab displays Swift-specific data.
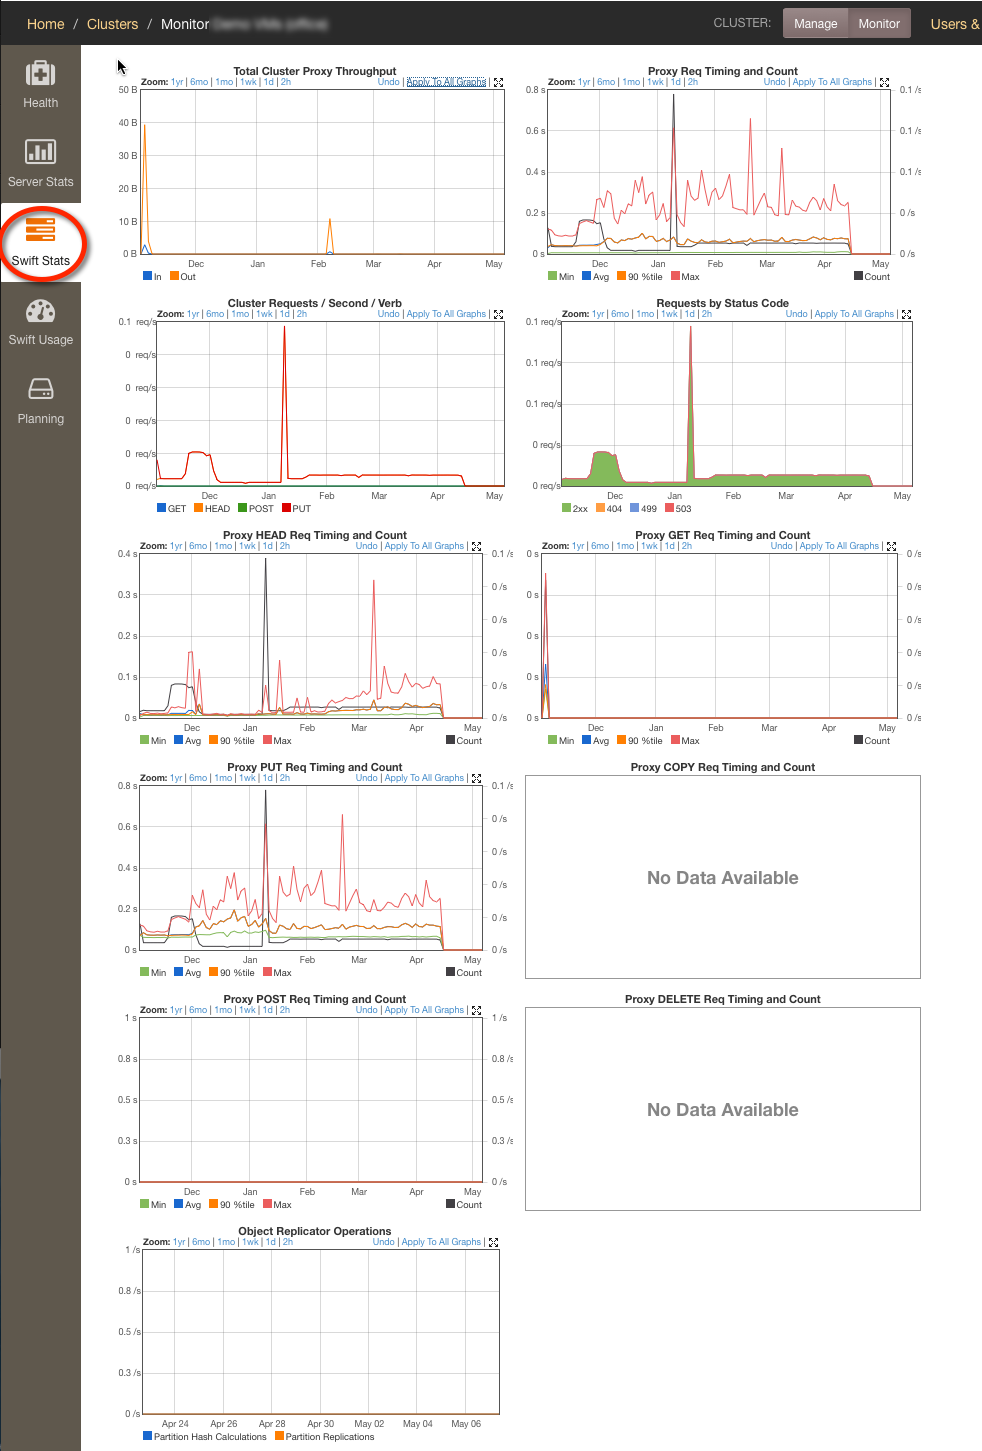
| Total Cluster Proxy Throughput | Displayed in bytes/second. This is the aggregate throughput for all inbound and outbound traffic. This graph will indicate network bottlenecks if any exist. |
| Proxy Req Timing and Count | Displays timing information for all Swift API requests. The left-hand Y-axis shows minimum, average, 90th-percentile, and maximum values for proxy request service-time. The right-hand Y-axis shows the total Swift API request per second rate. |
| Cluster Requests / Second / Verb | Displays requests per second for the DELETE, GET, HEAD, POST and PUT verbs. |
| Requests by Status Code | Displays requests by status codes 2xx, 403, 404, and 500. 2xx are good, 403 / 404 indicate clients trying to do things they aren't supposed to do, and 500 indicate server error. |
| Object Replicator Operations | Displays Partition Hash Calculations and Partition Replications. If you see spikes in the Partition Replications line, that could indicate that a drive is having trouble. |
Capacity Planning
The Planning tab helps to identify when new drive space will need to be added.
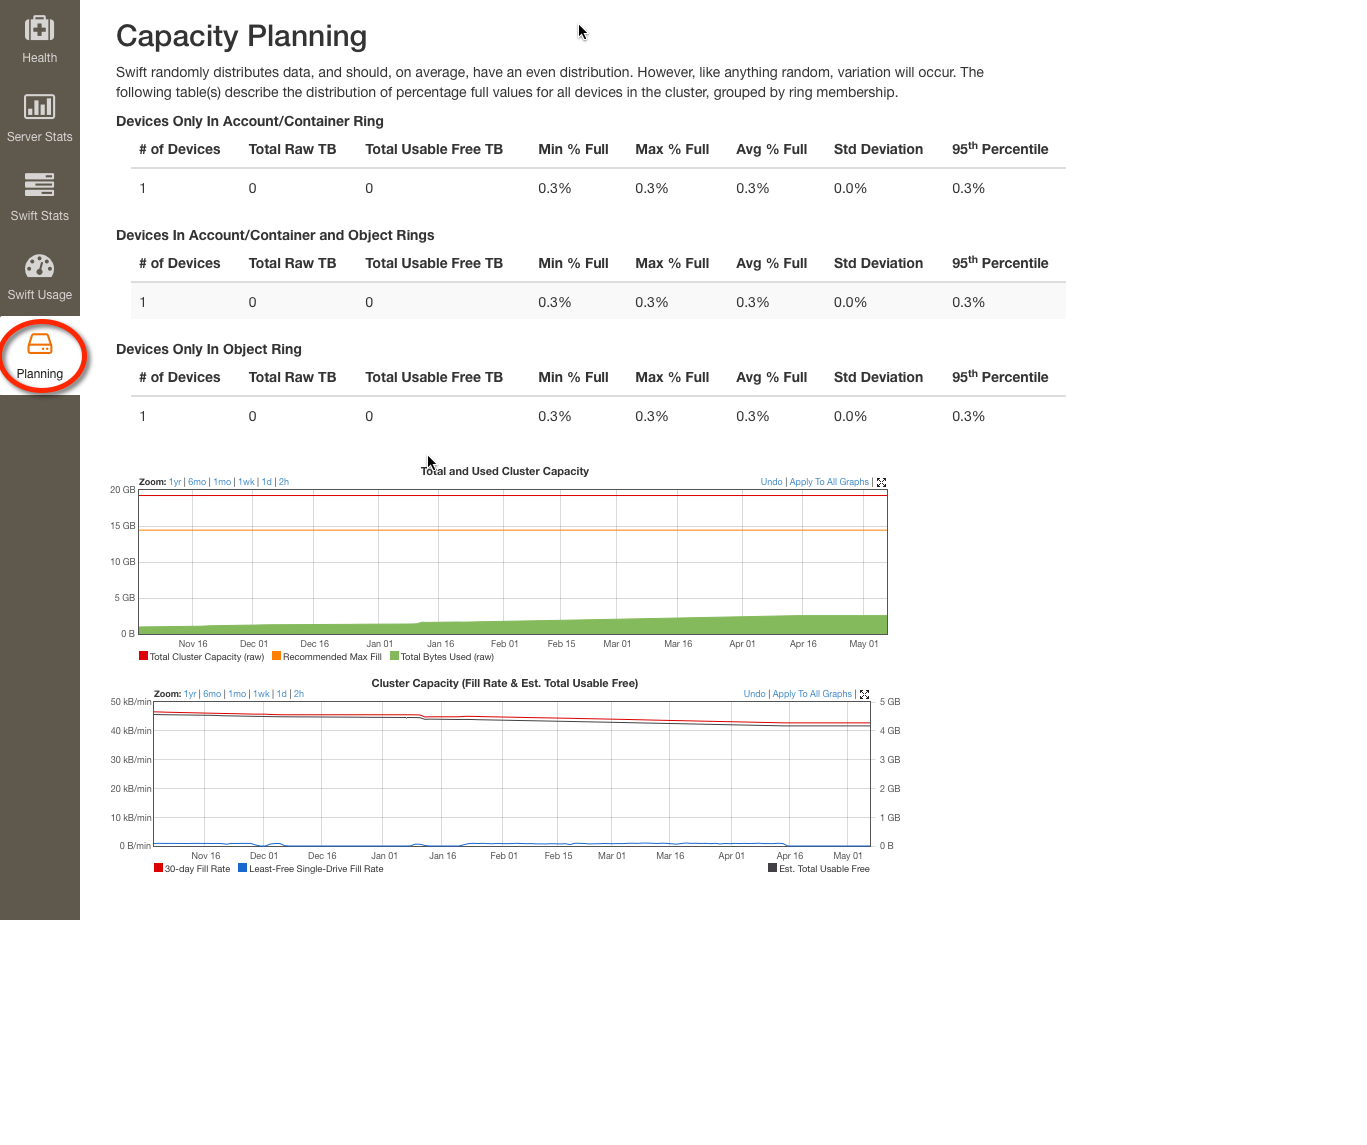
| Total and Used Cluster Capacity | When the Total Bytes Used value approaches the Recommended Max Fill line, it is time to add new drives. |
| Cluster Capacity | The Fill Rate metrics help predict at what rate additional capacity will need to be added. The Least-Free Single-Drive Fill Rate is a measure of how fast the cluster is filling. This metric shows the rate at which the least free drive in the system is filling up. The 30-day Fill Rate is the rate at which, if the least-free drive was filling at this rate, it would be full in 30 days. If the Least-Free Single-Drive Fill Rate exceeds the 30-day Fill Rate, then this is an indication, all things being equal, that the cluster will be full within 30 days. |
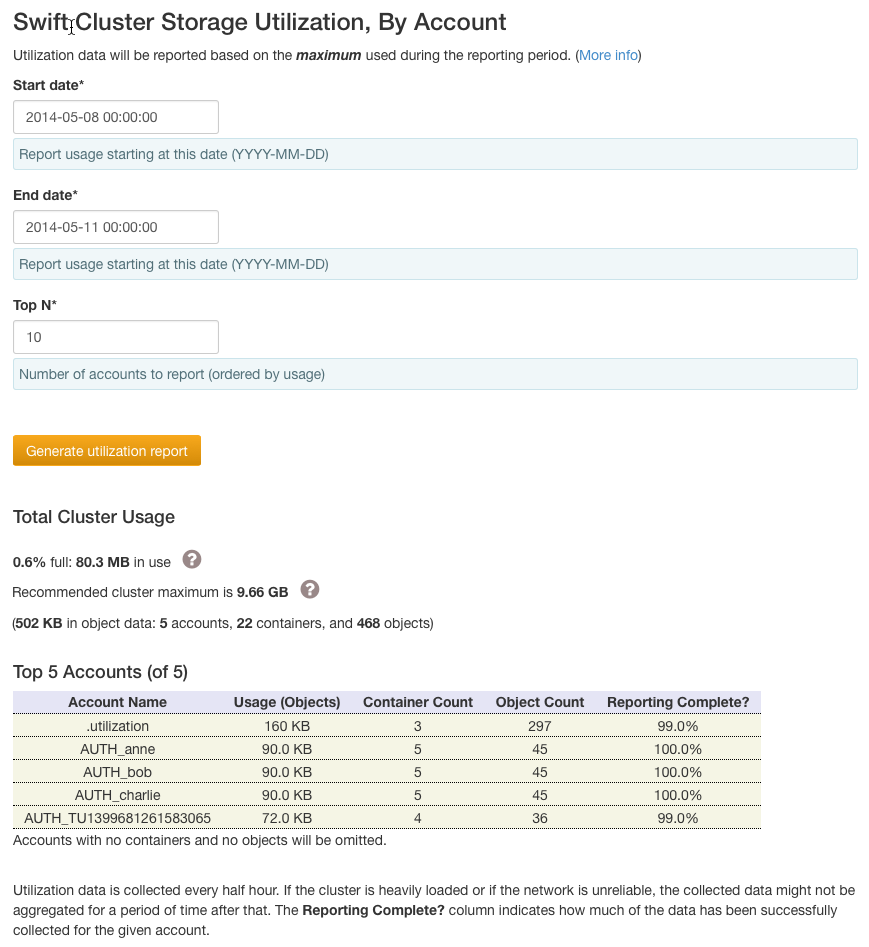
Swift Usage
The Swift Usage tab is a customizable report describing the total cluster usage and top N accounts by size. Start and End dates should be provided in UTC,