Node Monitoring
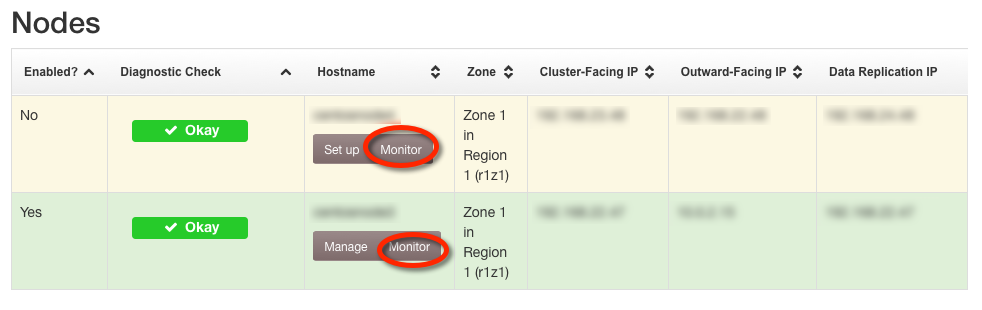
To view the Node Monitoring graphs, click on the Clusters link in the header, followed by Monitor for the desired cluster, the Nodes tab, and Monitor for the desired node.
Graphs
In addition to the graphs on this page, the Disks table describes the disks on this node and which rings they are a part of.
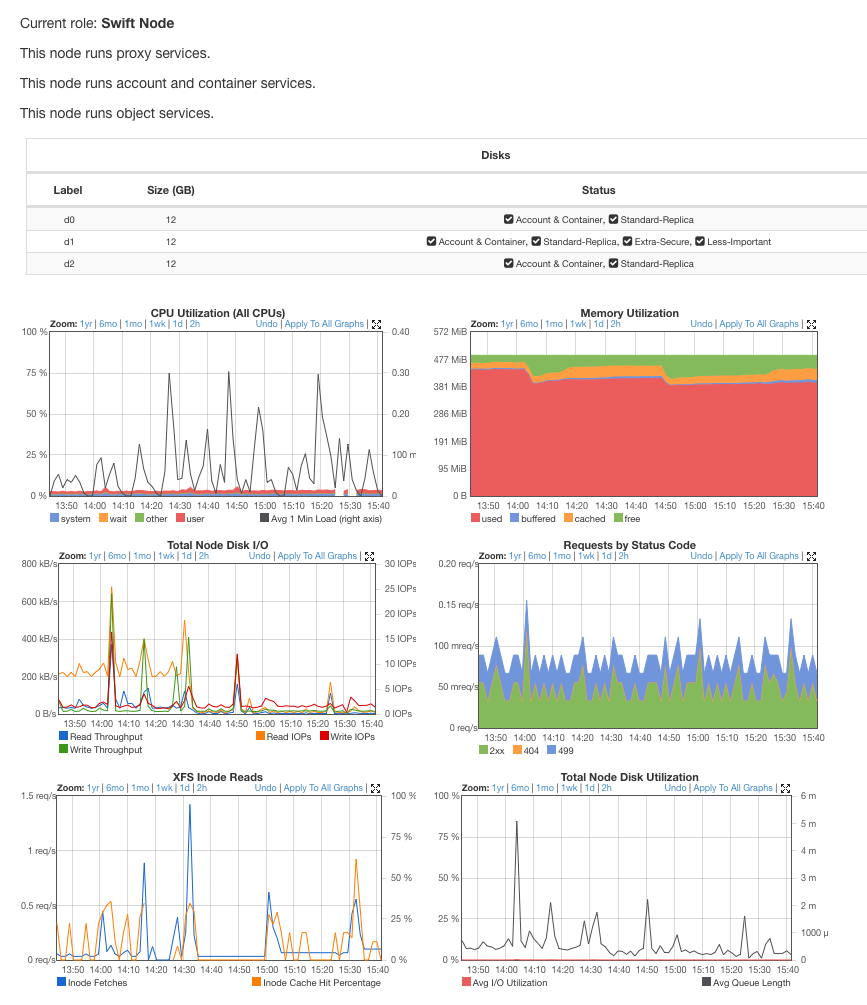
| CPU Utilization | Measure the percentage of the time that a node is using the CPU or performing disk I/O. High numbers are generally bad. |
| Total Node Disk I/O | Measures the total number of Input/Output Operations Per Second (IOPS) on drives. Disk I/O is shown for both Read IOPS and Write IOPS. Note that since Swift constantly guards against bitrot, the cluster will continuously read some amount of data. |
| Memory Utilization | Memory utilized is displayed as either used, buffered, cached or free. |
| Requests by Status Code | Displays requests by status codes 2xx, 403, 404, and 500. 2xx are good, 403 / 404 indicate clients trying to do things they aren't supposed to do, and 500 indicate server error. |
Node Monitoring Alerts
If a node becomes unreachable, a Node is unreachable alert will appear on the Alerts page.
If a drive on a node becomes unmounted, a Missing device alert will appear on the Alerts page.
If Swift becomes unstable on a node, a Swift has gone offline alert will appear on the Alerts page.